Important Cycles
A 52-day cycle making its low on 5/14 interjected itself before the next 80-day Hurst (45-td) cycle low due ~6/08. This had the effect of altering the short-term price structure.
Point and Figure Overview of SPX
Intermediate trend: I should have stayed with my previous 2970 projection! A new distribution pattern is now in progress between 2940-2980.
Market Analysis (Charts courtesy of QChart)
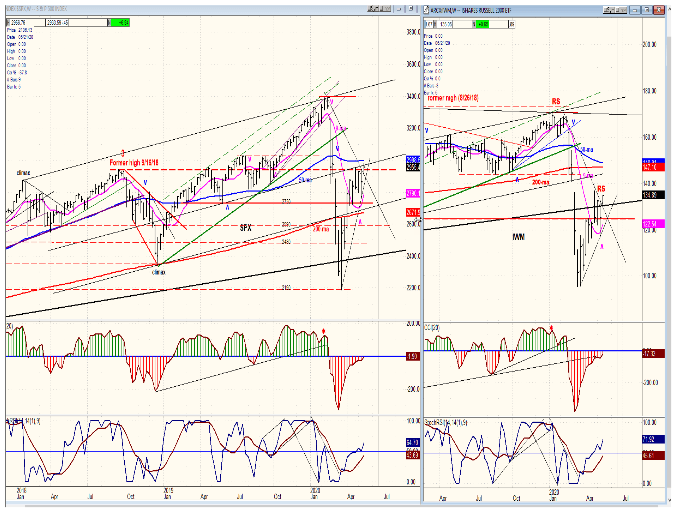
SPX-IWM weekly charts
The new cycle had enough strength to take the SPX slightly beyond its high of three weeks ago. This altered the P-F pattern and caused the distribution phase to take place at a higher level, thereby modifying the short-term price analysis and nullifying the previous downside projection. Next week should determine if the high of the 80-day cycle has been reached. The 50-wk MA is a short distance higher and should act as resistance if the index challenges that level.
IWM failed to make a new high and remains a laggard.
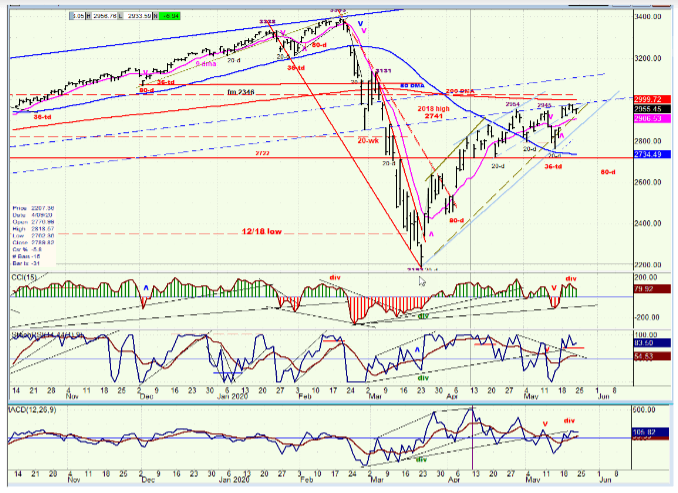
SPX daily chart
The 52-calendar day cycle (36-td) was unexpected and has altered the price structure, causing the index to reach a slightly new high instead of starting the 80-day decline from a lower level. Friday’s price action suggests that we may not be finished with the short-term topping formation which is underway. If there is a new high ahead, it should be restricted by the 200-dma, which roughly corresponds to the 50-wk MA and currently runs at about 3000.
With the 80-day cycle low rapidly approaching, we should be very close to beginning a decline into its due date during the first week of June, but with IWM slightly stronger over the near-term (while weaker at the weekly level) it is not unconceivable that both indices could make a new high next week before rolling over.
The daily oscillators have already turned down but have remained positive. They will have to turn and stay negative before we can be convinced that an intermediate term signal has been given.
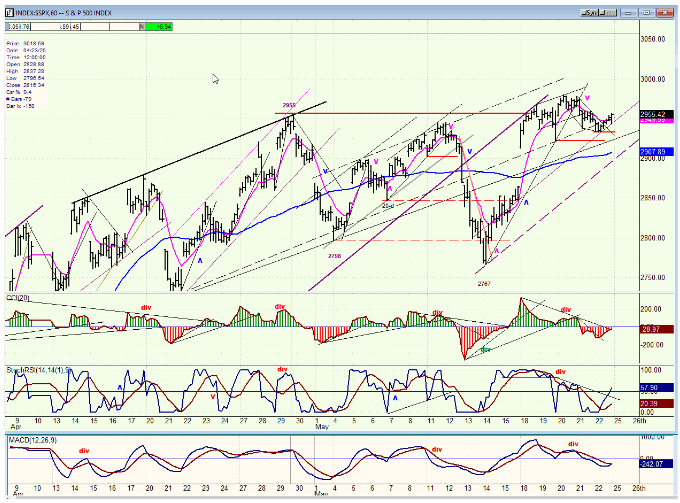
SPX hourly chart
It is “interesting” that overnight futures dropped down to 2905 (the level of the SPX hourly 50-MA) and rallied strongly by Friday’s opening. When this happens, SPX will often retest the overnight lows shortly after the opening, but this was not the case on Friday. SPX only formed a small base at 2933 and rallied for the rest of the day, almost turning the existing sell signal into a buy. If we open higher next Tuesday, we may retest the 2980 high before we are pulled lower by the 80-day cycle. This would increase the current congestion pattern which has formed above 2940.
At a minimum, trading below its week’s low would bring about a sell signal.
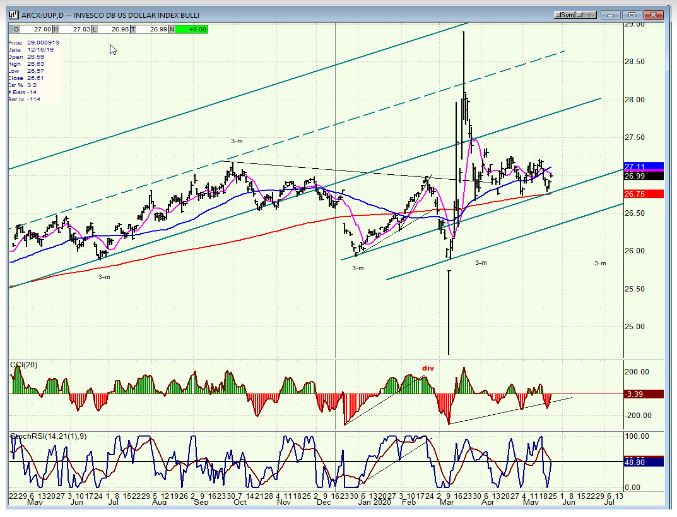
UUP (dollar ETF) daily
UUP continues to trade in a narrow range, but could soon be pulled down into the 3-mo cycle low which is now only about a month away.
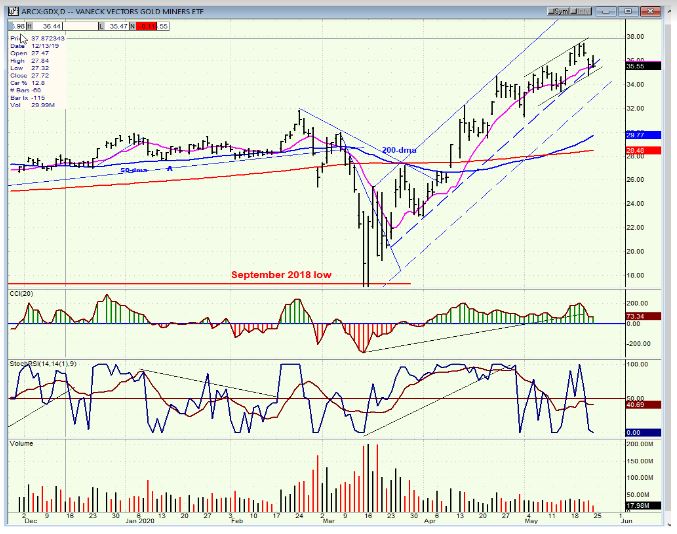
GDX (Gold miners ETF) daily
GDX has continued to extend its uptrend and filled an interim projection to 37.50. After a short consolidation, it could extend to about 39.00 before entering in a much more important consolidation period.
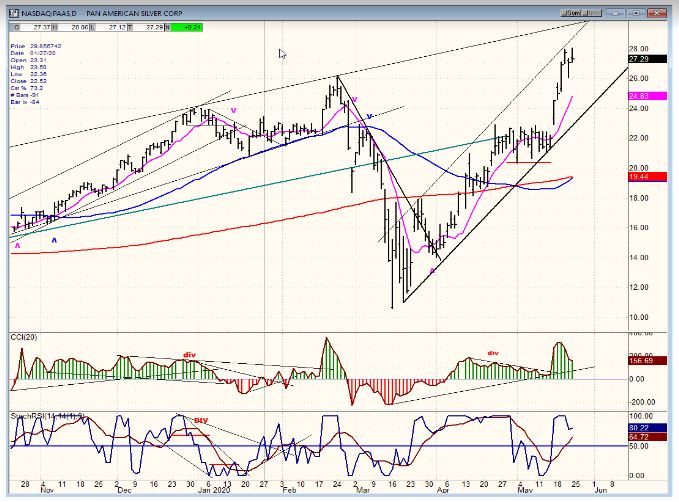
PAAS (Pan American Silver Corp.) daily
PAAS should be able to reach ~30.00 (in conjunction with GDX 39.00) before rolling over and starting a corrective pattern.
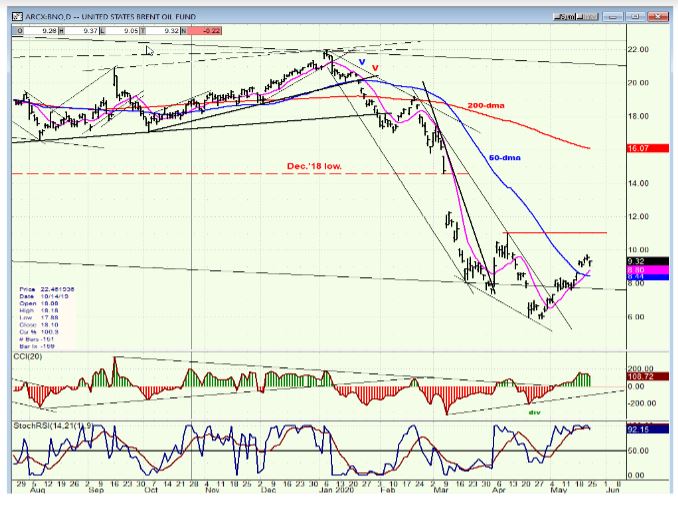
BNO (U.S. Brent oil fund) daily
BNO should push a little higher as SPX makes a short-term top before declining into the 80-day cycle low.
Summary
An “encroaching” cycle (52-day) made its low on 5/14 and altered the short-term index structure. This will reduce the future impact of the 80-day cycle to a much less significant decline than it would have been otherwise. Since the short-term top is not completely formed just yet, we will need to see just how much congestion is produced before we can gauge the cycle’s impact.
"behavior" - Google News
May 25, 2020 at 01:12PM
https://ift.tt/3gmwVLu
Topping behavior - FXStreet
"behavior" - Google News
https://ift.tt/2We9Kdi
Bagikan Berita Ini


0 Response to "Topping behavior - FXStreet"
Post a Comment